Difference between revisions of "Data Management"
From crtc.cs.odu.edu
| Line 1: | Line 1: | ||
== Next-generation imaging filters and mesh-based data representation for phase-space calculations in nuclear femtography == | == Next-generation imaging filters and mesh-based data representation for phase-space calculations in nuclear femtography == | ||
| − | + | ||
[[File:Paraview_plot.png|400px| ]] | [[File:Paraview_plot.png|400px| ]] | ||
| | | | ||
| Line 11: | Line 11: | ||
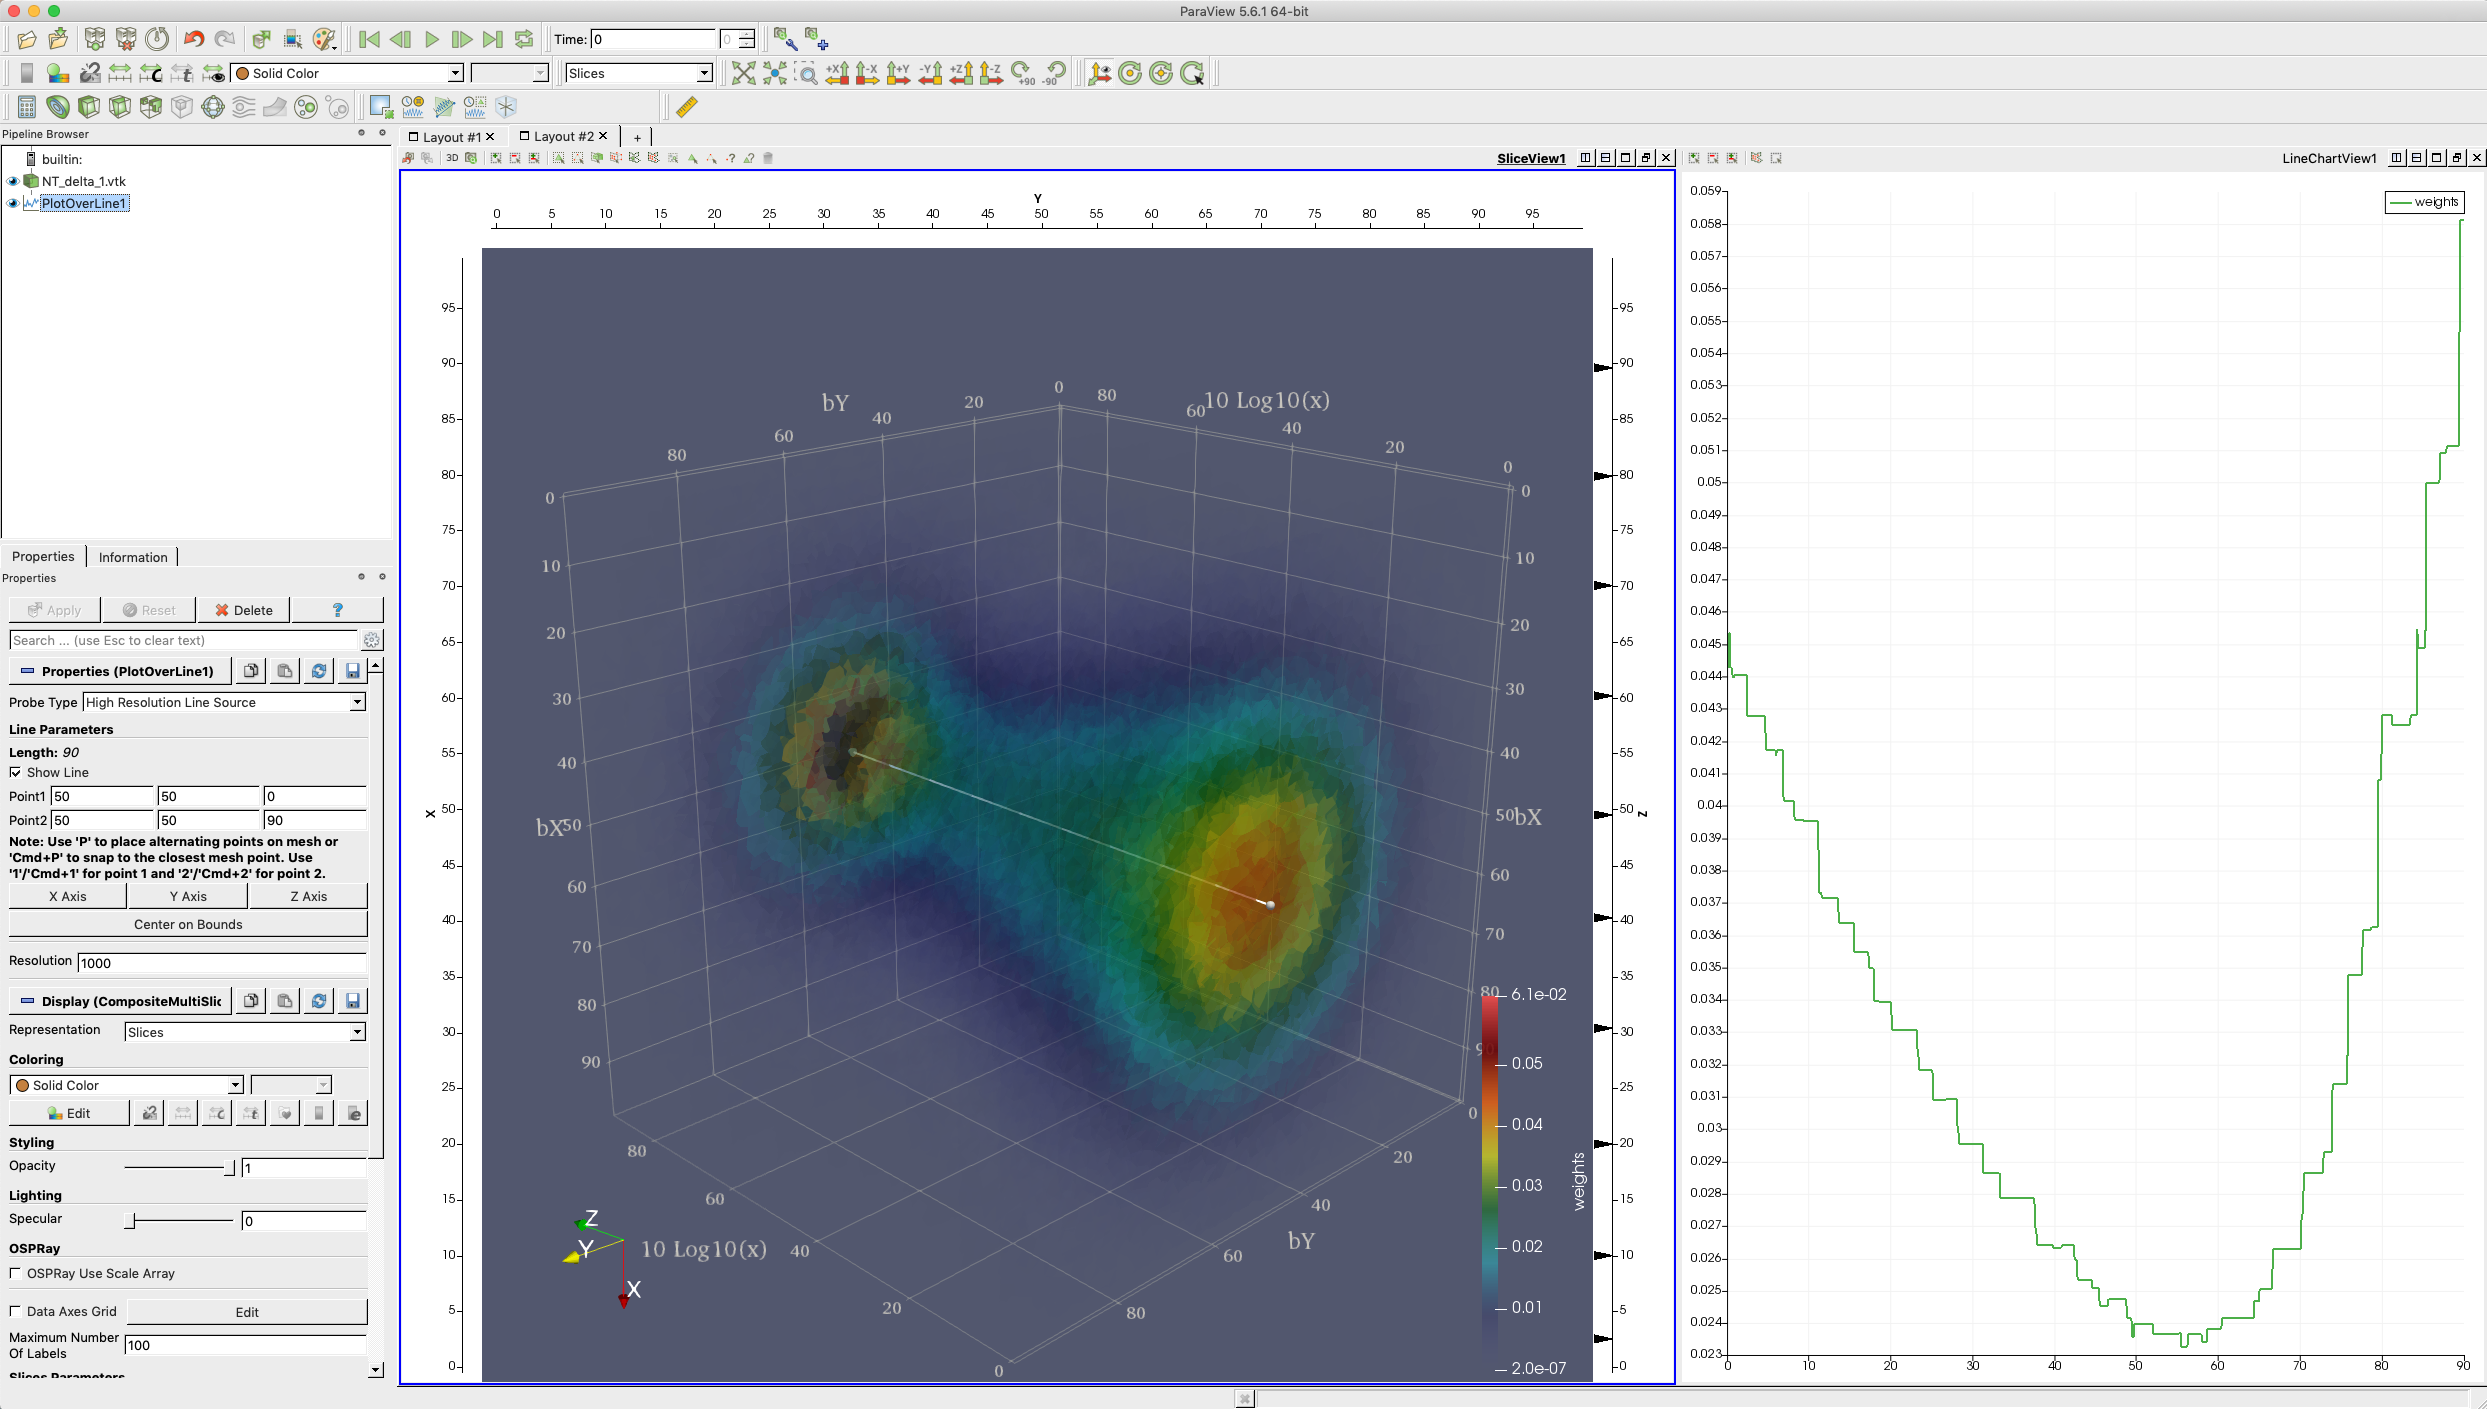
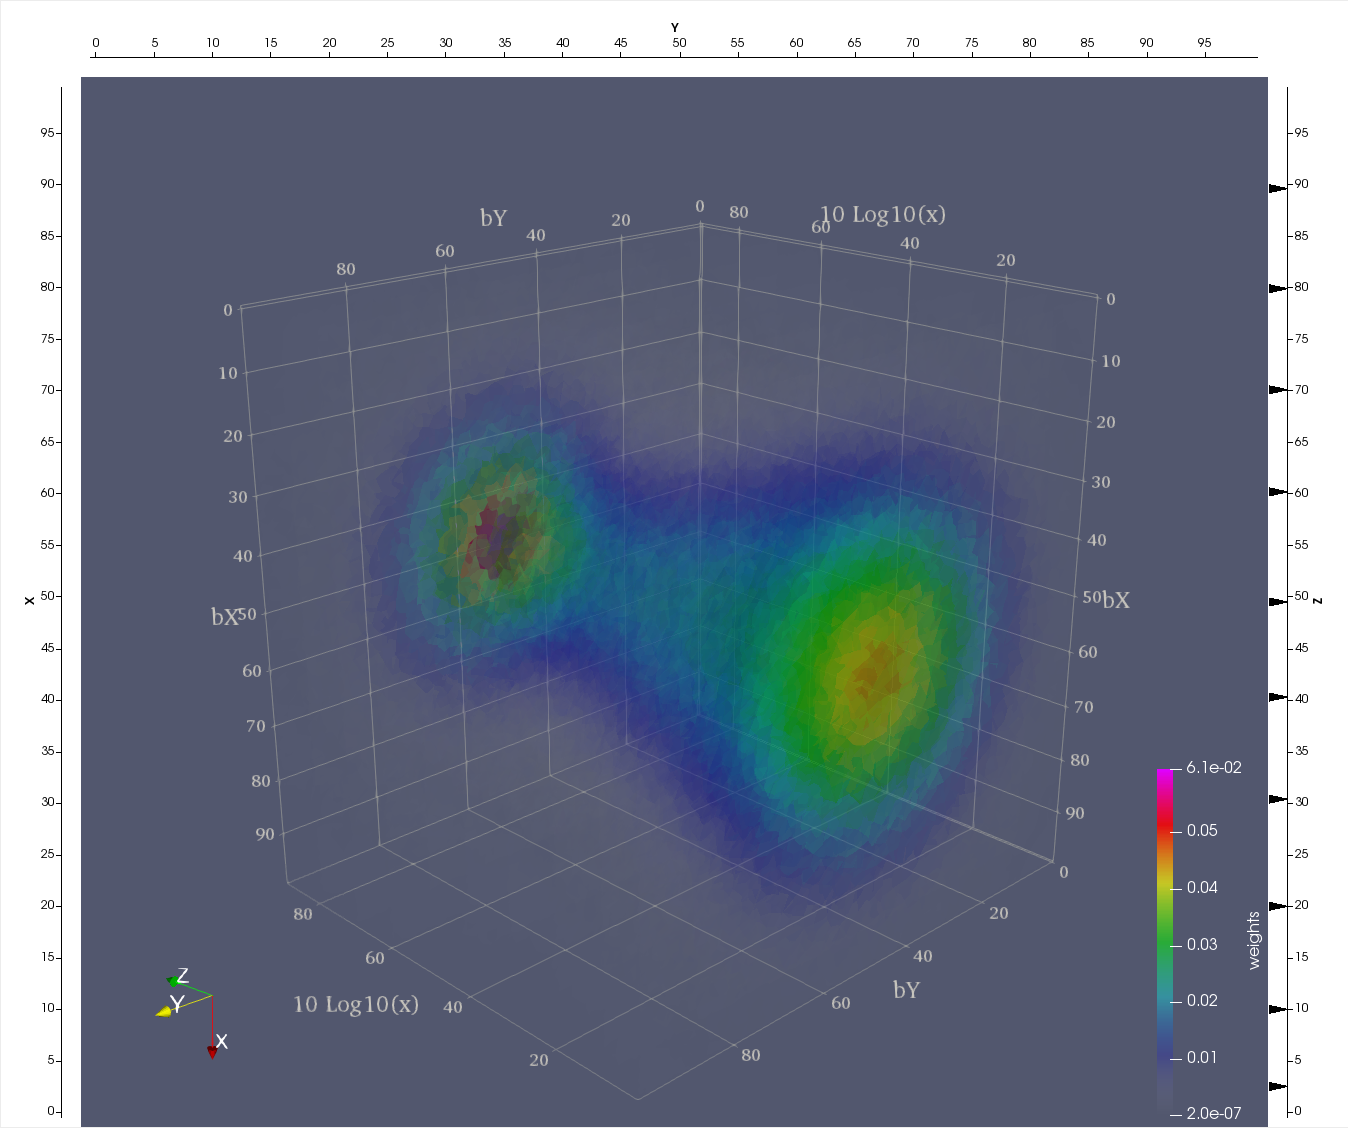
Tomographic pictures of the nucleon. Namely, the plots show a spatial distribution of up quarks as a function of proton's momentum fraction carried by those quarks. Specifically, bX and bY are the spatial coordinates (in 1/GeV = 0.197 fm) defined in a plane perpendicular to the nucleon’s motion, x is the fraction of proton’s momentum and color denotes probability density for finding a quark at given (bX, bY, x). Plots produced by Dr. Gagik Gavalian and Dr. Pawel Sznajder and tesselate by CRTC's tessellation software. | Tomographic pictures of the nucleon. Namely, the plots show a spatial distribution of up quarks as a function of proton's momentum fraction carried by those quarks. Specifically, bX and bY are the spatial coordinates (in 1/GeV = 0.197 fm) defined in a plane perpendicular to the nucleon’s motion, x is the fraction of proton’s momentum and color denotes probability density for finding a quark at given (bX, bY, x). Plots produced by Dr. Gagik Gavalian and Dr. Pawel Sznajder and tesselate by CRTC's tessellation software. | ||
| + | For more data and information about this project follow this link: [[CNF]] | ||
== Exascale-Era Finite Element Mesh Generation == | == Exascale-Era Finite Element Mesh Generation == | ||
Revision as of 15:45, 9 July 2019
Contents
Next-generation imaging filters and mesh-based data representation for phase-space calculations in nuclear femtography
 |
|
 |- style="text-align: left;"
||||
|}
Tomographic pictures of the nucleon. Namely, the plots show a spatial distribution of up quarks as a function of proton's momentum fraction carried by those quarks. Specifically, bX and bY are the spatial coordinates (in 1/GeV = 0.197 fm) defined in a plane perpendicular to the nucleon’s motion, x is the fraction of proton’s momentum and color denotes probability density for finding a quark at given (bX, bY, x). Plots produced by Dr. Gagik Gavalian and Dr. Pawel Sznajder and tesselate by CRTC's tessellation software.
For more data and information about this project follow this link: CNF
