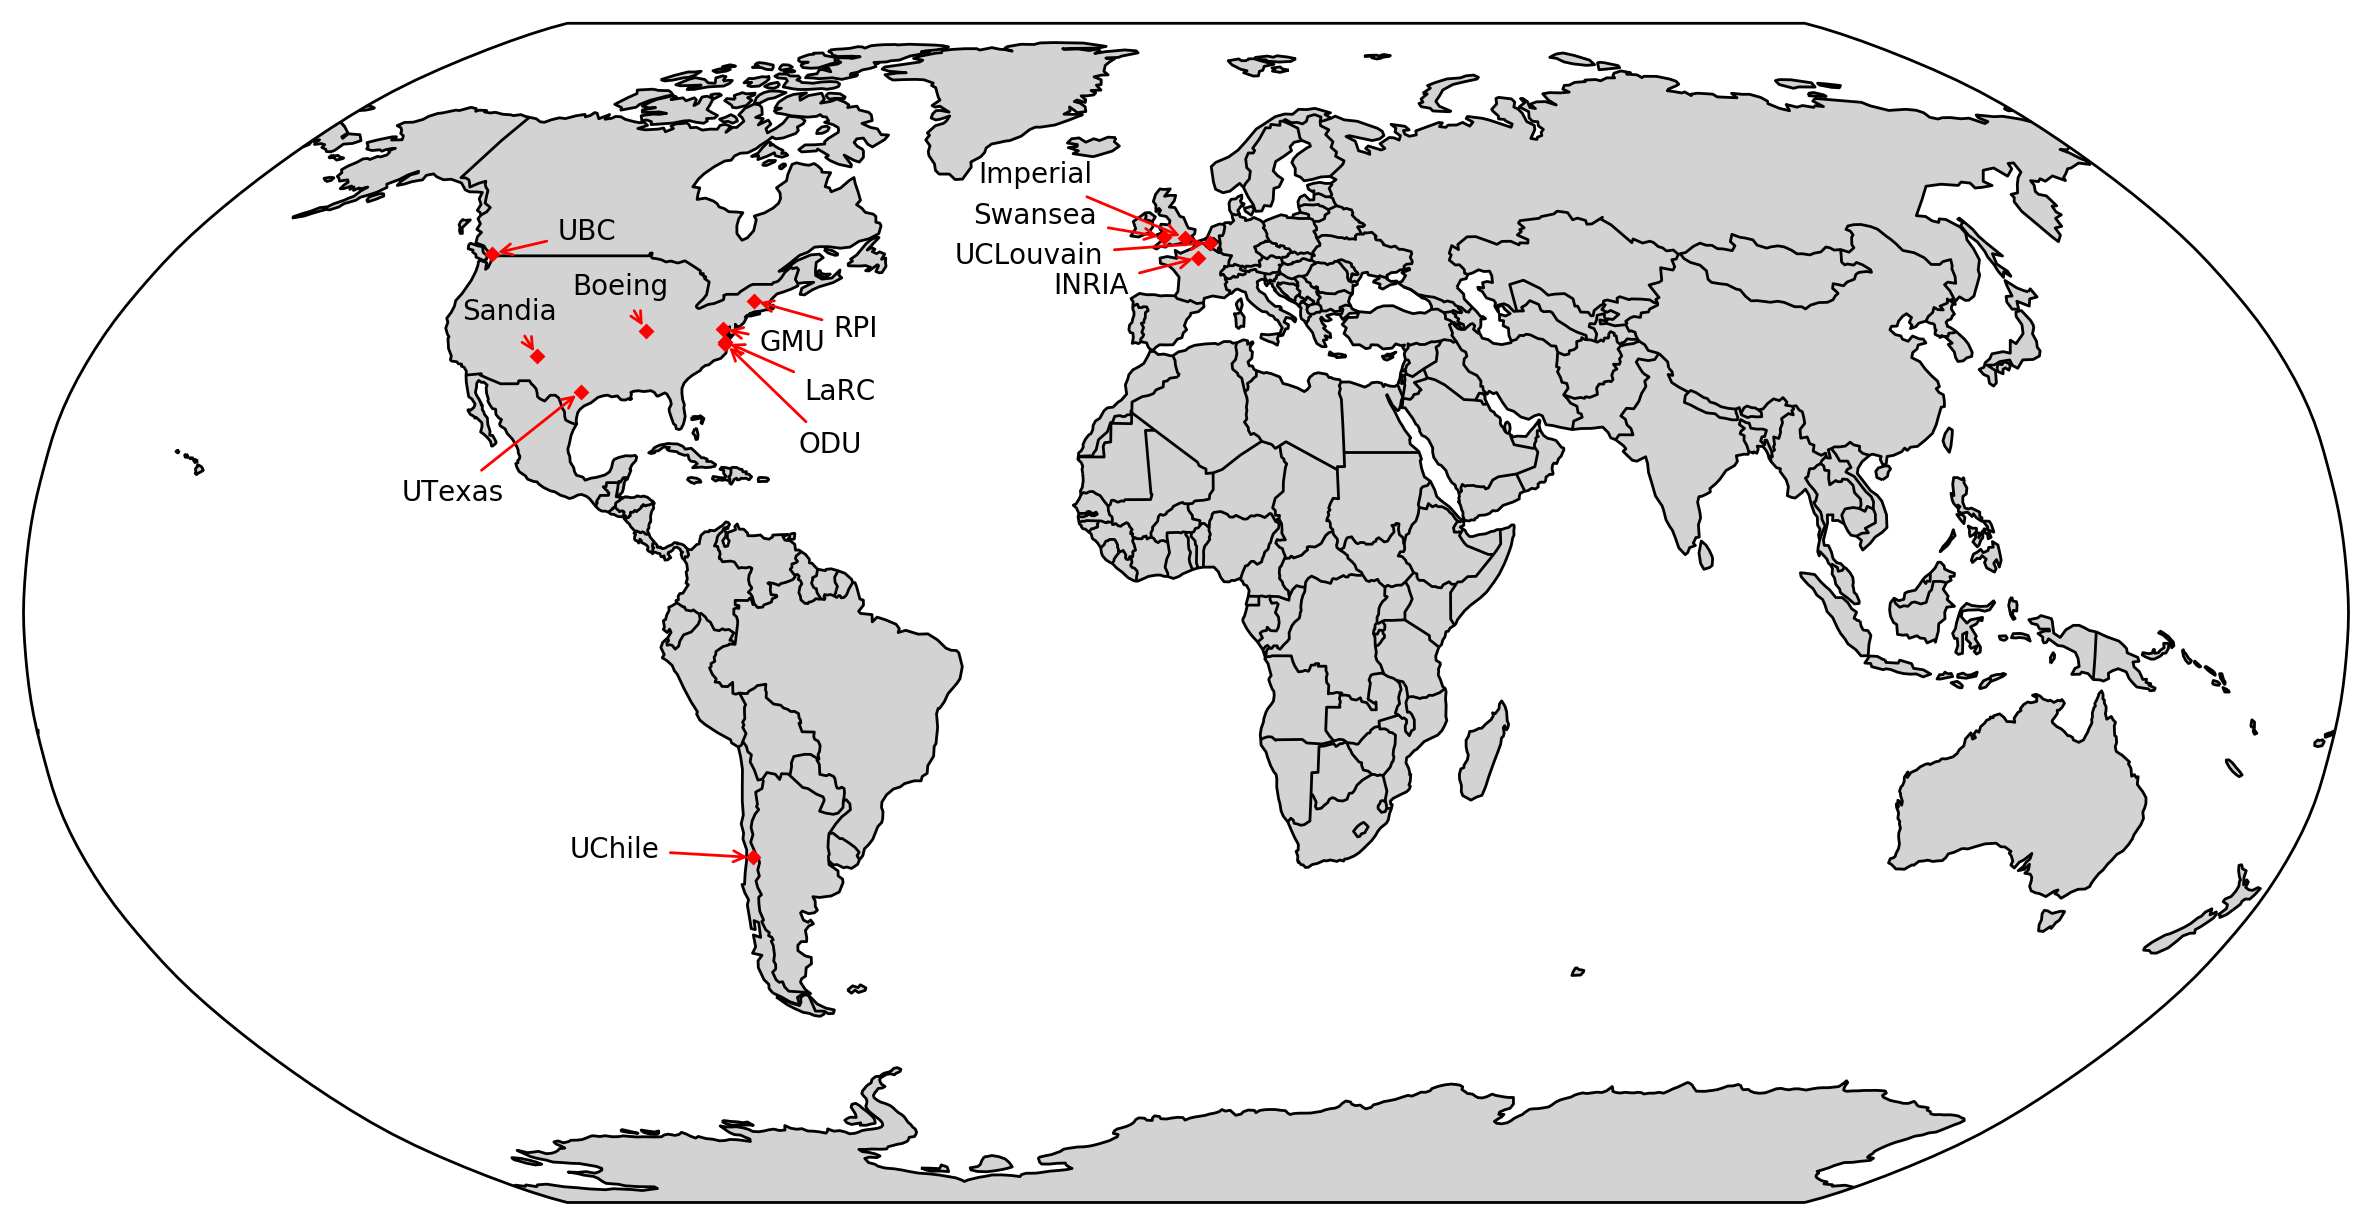
File:Parallel Mesh Generation Around the world.png
From crtc.cs.odu.edu
Size of this preview: 800 × 413 pixels. Other resolutions: 320 × 165 pixels | 2,372 × 1,226 pixels.
Original file (2,372 × 1,226 pixels, file size: 542 KB, MIME type: image/png)
Script to generate it :
import cartopy.crs as ccrs
import cartopy.feature as cfeature
import matplotlib.pyplot as plt
fig=plt.figure(figsize=[15,10])

ax = plt.axes(projection=ccrs.Robinson())
ax.add_feature(cfeature.LAND,facecolor='lightgrey')
#ax.add_feature(cfeature.OCEAN)
ax.add_feature(cfeature.COASTLINE)
ax.add_feature(cfeature.BORDERS)

# make the map global rather than have it zoom in to
# the extents of any plotted data
#ax.set_global()

#ax.set_extent([-160,160,-90,90])


#https://stackoverflow.com/a/25421922
transform = ccrs.PlateCarree()._as_mpl_transform(ax)
for key, value in places.items():
    print(key)
    lon,lat,x,y = value
    # add marker
    plt.plot(lon,lat, marker='D',color='red',markersize=3,transform=ccrs.Geodetic())
    # add text
    plt.annotate(key,xy=(lon,lat), xytext=(x,y),arrowprops=dict(arrowstyle="->",color='red'),xycoords=transform)

# Save the plot by calling plt.savefig() BEFORE plt.show()
#plt.savefig('map.svg')
plt.savefig('map.png',dpi=200,bbox_inches='tight')

plt.show()
File history
Click on a date/time to view the file as it appeared at that time.
| Date/Time | Thumbnail | Dimensions | User | Comment | |
|---|---|---|---|---|---|
| current | 21:41, 10 September 2018 | | 2,372 × 1,226 (542 KB) | Ctsolakis (talk | contribs) | |
| 18:21, 6 September 2018 | 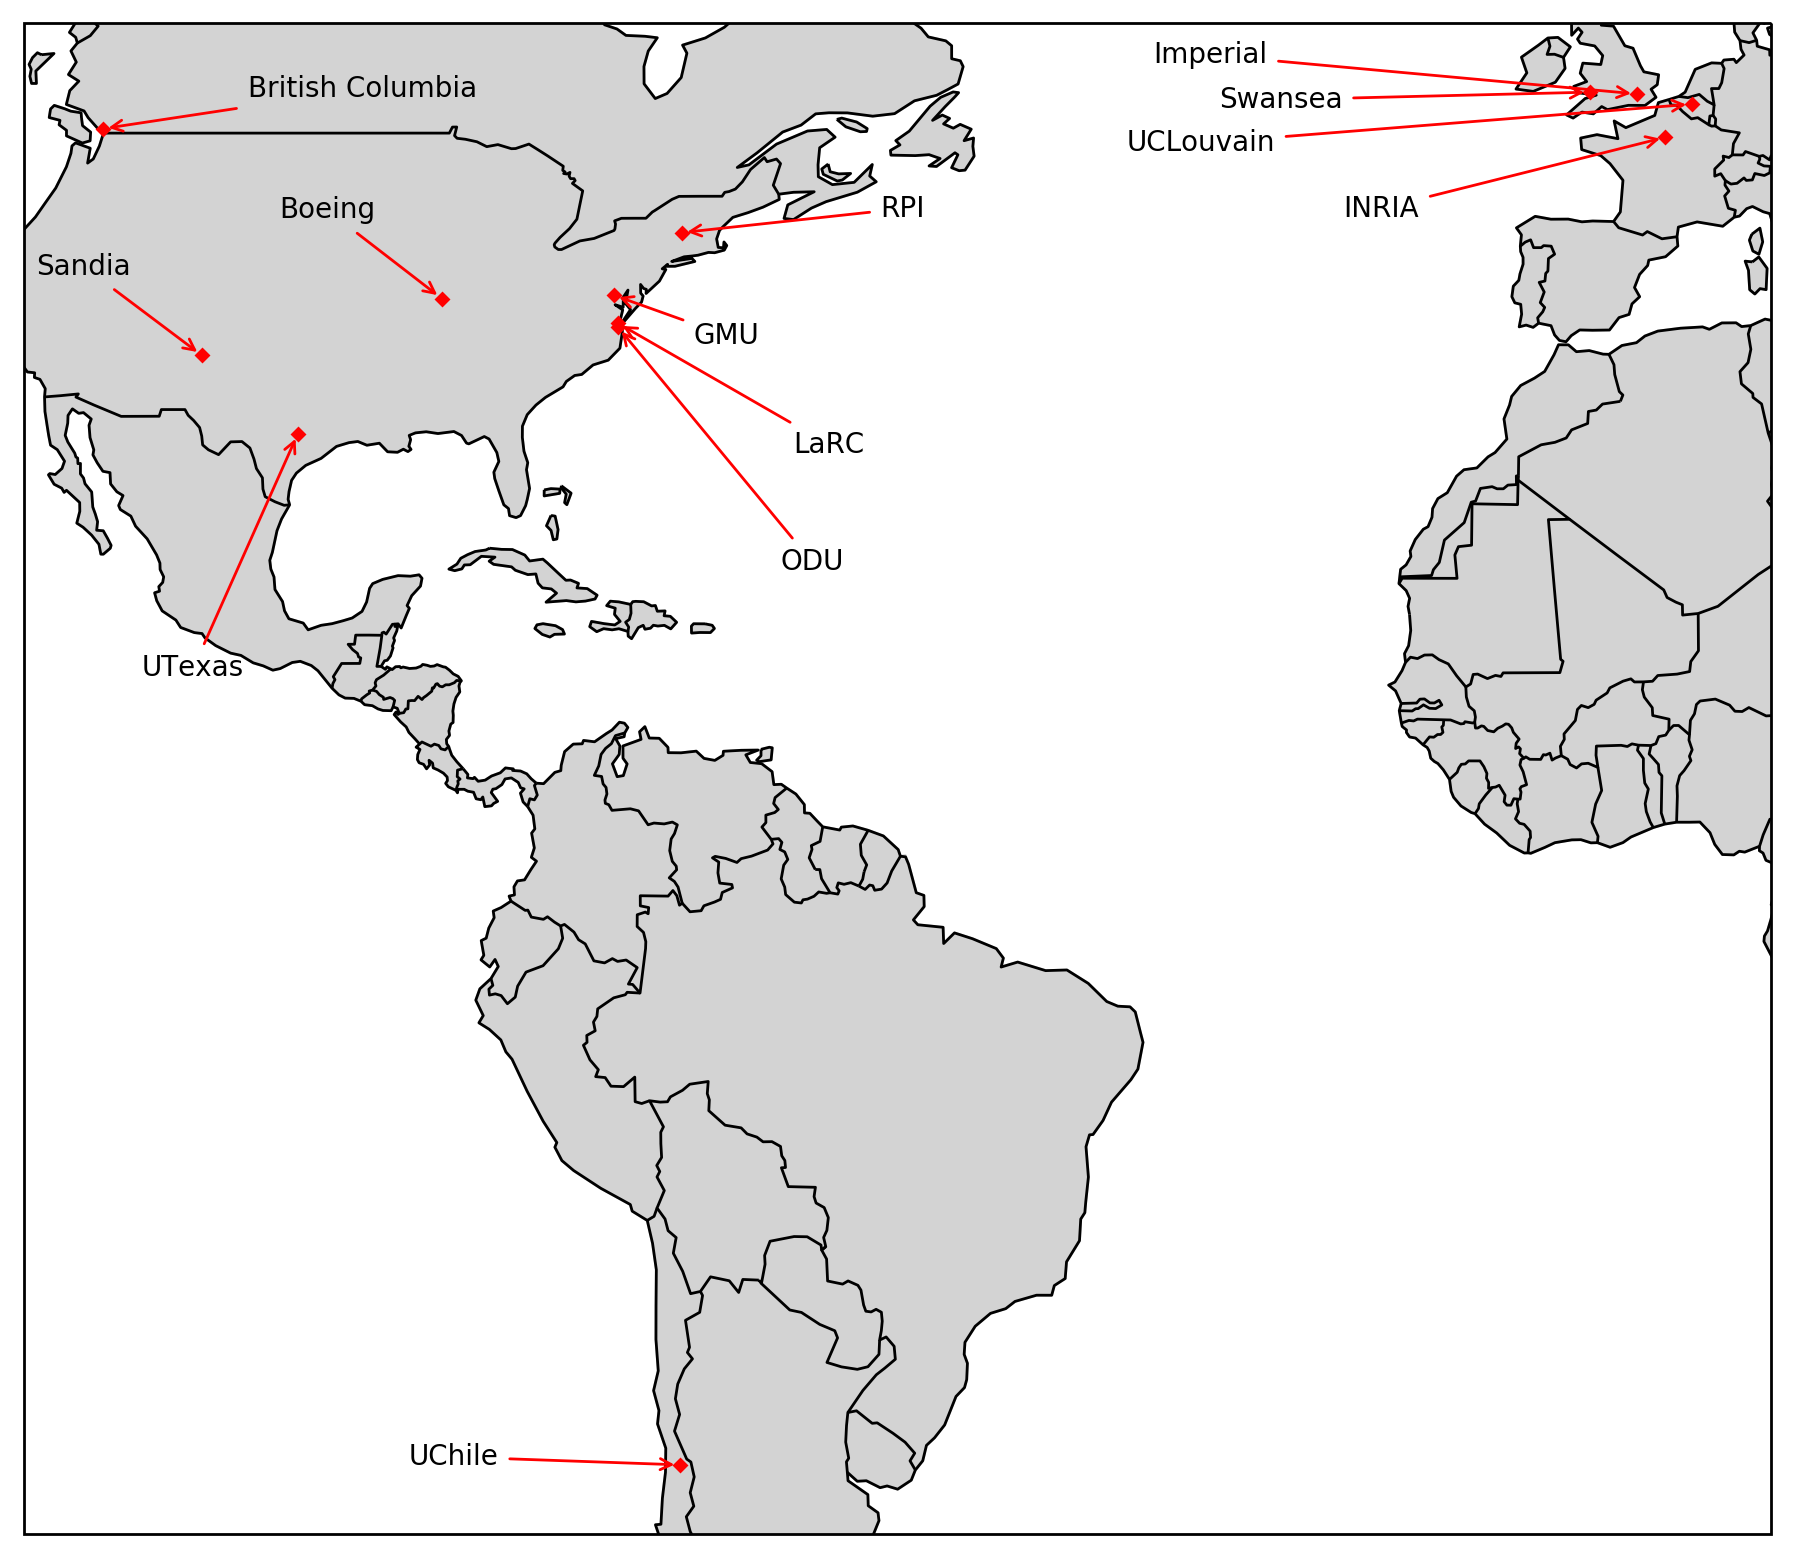 | 1,794 × 1,557 (319 KB) | Ctsolakis (talk | contribs) | ||
| 18:06, 6 September 2018 | 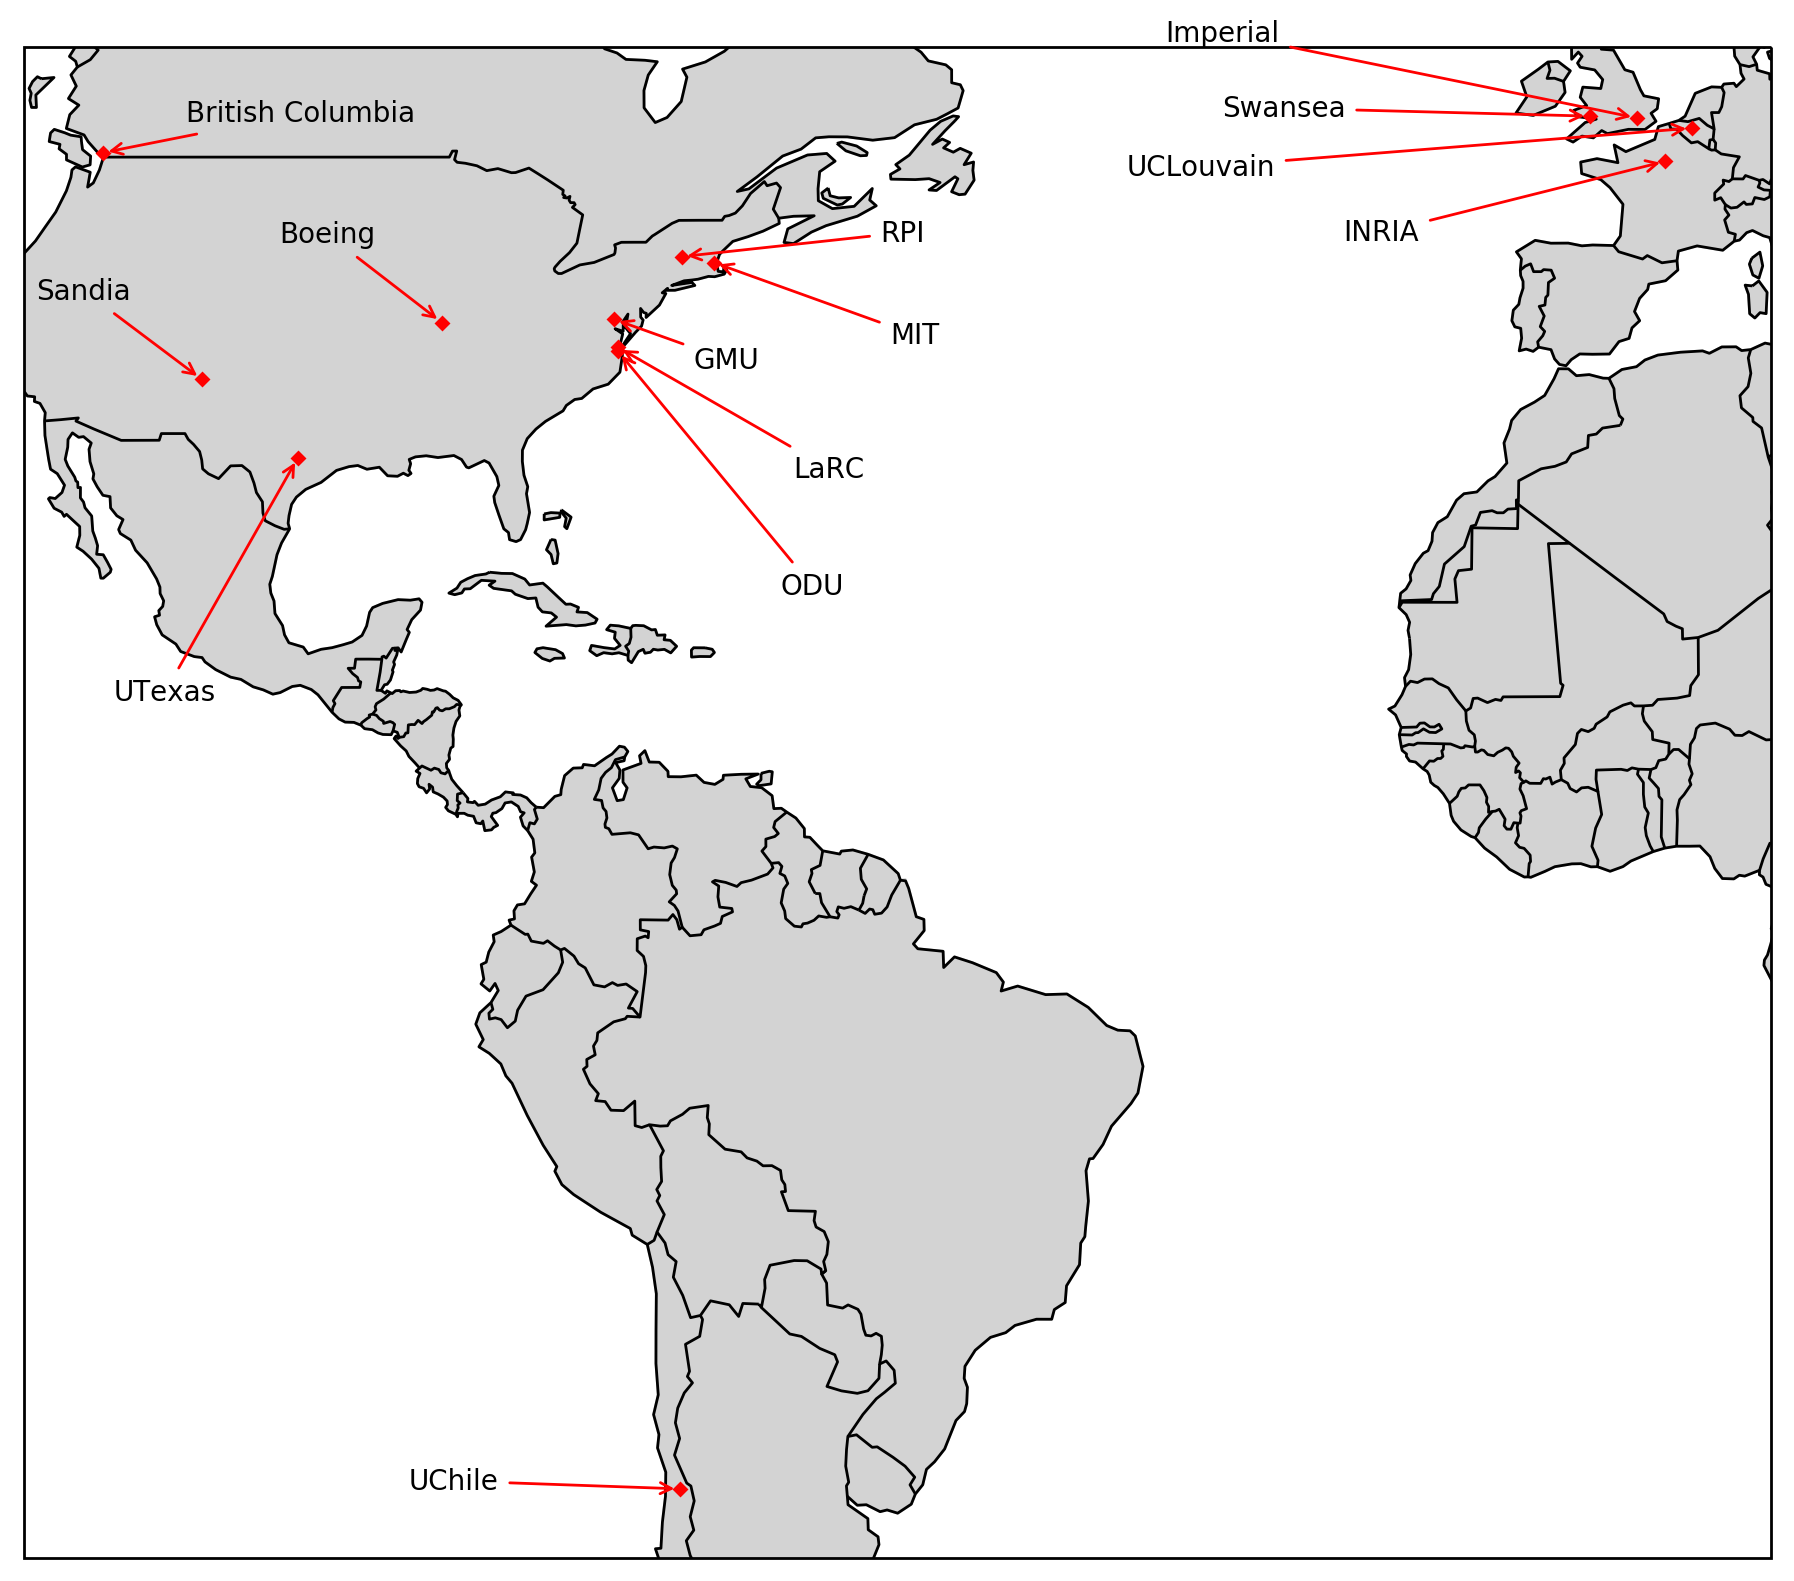 | 1,794 × 1,581 (323 KB) | Ctsolakis (talk | contribs) |
- You cannot overwrite this file.
File usage
There are no pages that link to this file.