|
|
| Line 22: |
Line 22: |
| * [[Internal:ACDT3D_(Scitech2018)_stability_data | Stability Data for 500k]] | | * [[Internal:ACDT3D_(Scitech2018)_stability_data | Stability Data for 500k]] |
| [[#Contents | Back To Top]] | | [[#Contents | Back To Top]] |
|
| |
| = Stability for 500k case=
| |
| == Comparison of Quality Metric using different amount of cores and surface adaptation ==
| |
| [[File:Histogram_mean_adapt.png|500px]]
| |
| [[File:Histogram_ratio_adapt.png|500px]]
| |
| [[#Contents | Back To Top]]
| |
| == Comparison of Quality Metric using different amount of cores and mesh reconstruction ==
| |
| [[File:Histogram_mean_reconstruct.png|500px]]
| |
| [[File:Histogram_ratio_reconstruct.png|500px]]
| |
| [[#Contents | Back To Top]]
| |
| ==Comparison Surface Adaptation vs Mesh Reconstruction (reproducibility) ==
| |
|
| |
| ''' TODO needs update '''
| |
|
| |
| [[File:Histogram_mean_compare.png|500px]]
| |
| [[File:Histogram_ratio_compare.png|500px]]
| |
|
| |
| Surface adaptation offers better edge lengths but mesh reconstruction slightly better mean ratio quality
| |
Delta Wing (Scitech 2018)
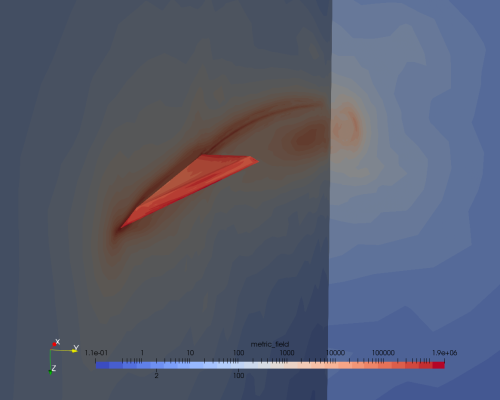
Strong scaling Data
scalable complexity data
Cube (polar-2 metric) (Scitech 2018)
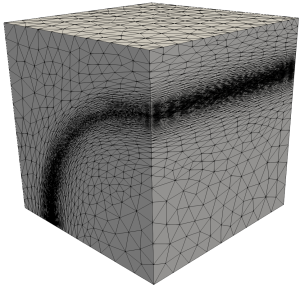
Strong Scaling Data
This approach offers no boundary adaptation.
General Notes
Back To Top

