Difference between revisions of "Runtime Systems"
Pthomadakis (talk | contribs) (→Decoupled CDT3D) |
Pthomadakis (talk | contribs) (→Synthetic Benchmark) |
||
| Line 61: | Line 61: | ||
! colspan="2"|Total time (sec) | ! colspan="2"|Total time (sec) | ||
|- | |- | ||
| − | ! Max || Min || Avg || ILB || MPI || ILB || MPI || ILB || MPI || ILB || MPI | + | ! Max || Min || Avg || ILB || MPI || ILB || MPI || ILB || MPI || ILB || MPI |
|- | |- | ||
| − | |320 || 0.84 || 0.0001 || 0.07 || 0.83 || 1.28 || || || 494.4 || 681.8 || 495.5 || 683.2 | + | |320 || 0.84 || 0.0001 || 0.07 || 0.83 || 1.28 || || 324.9 || 494.4 || 681.8 || 495.5 || 683.2 |
|- | |- | ||
| − | |640 || 0.82 || 0.0001 || 0.05 || 1.39 || 0.97 || || || 495.1 || | + | |640 || 0.82 || 0.0001 || 0.05 || 1.39 || 0.97 || || 321.4 || 495.1 || 687.1 || 496.8 || 692.7 |
|- | |- | ||
| − | |1280 || 0.76 || 0.0001 || 0.05 || 1.35 || 1.57 || || || 497.7 || | + | |1280 || 0.76 || 0.0001 || 0.05 || 1.35 || 1.57 || || 324.7 || 497.7 || 704.1 || 499.3 || 713.1 |
|- | |- | ||
| − | |3200 || 0.37 || 0.0002 || 0.05 || 2.81 || 2.31 || || || 516.4 || | + | |3200 || 0.37 || 0.0002 || 0.05 || 2.81 || 2.31 || || 322.1 || 516.4 || 691.9 || 520.5 || 717.2 |
|- | |- | ||
| − | |4800 || 0.35 || 0.0001 || 0.04 || 2.77 || 3.64 || || || 519.8 || | + | |4800 || 0.35 || 0.0001 || 0.04 || 2.77 || 3.64 || || 322.6 || 519.8 || 704.7 || 524.9 || 745.5 |
|- | |- | ||
| − | |5600 || 0.48 || 0.0003 || 0.04 || 3.36 || 5.75 || || || 520.4 || | + | |5600 || 0.48 || 0.0003 || 0.04 || 3.36 || 5.75 || || 310.6 || 520.4 || 717.8 || 526.4 || 770.1 |
|} | |} | ||
Revision as of 07:46, 28 March 2018
PREMA 2.0
Synthetic Benchmark
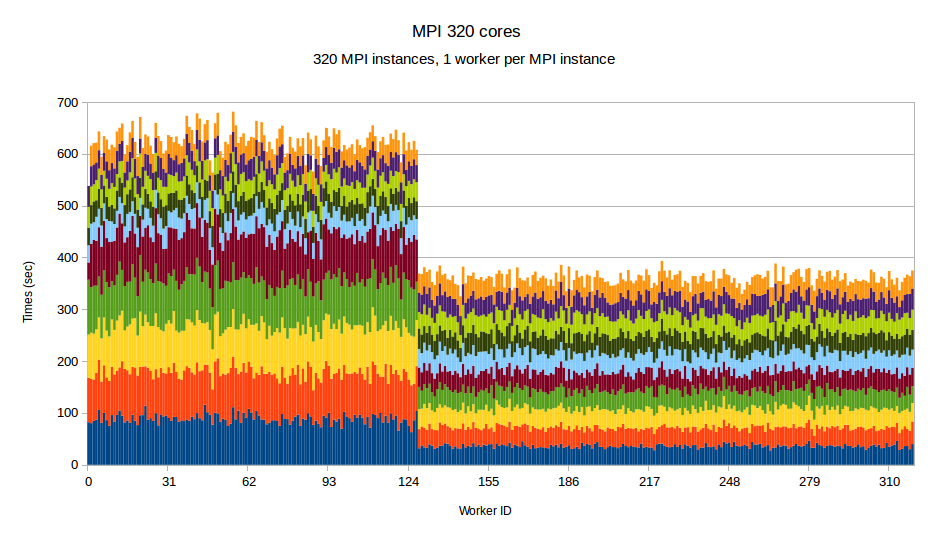
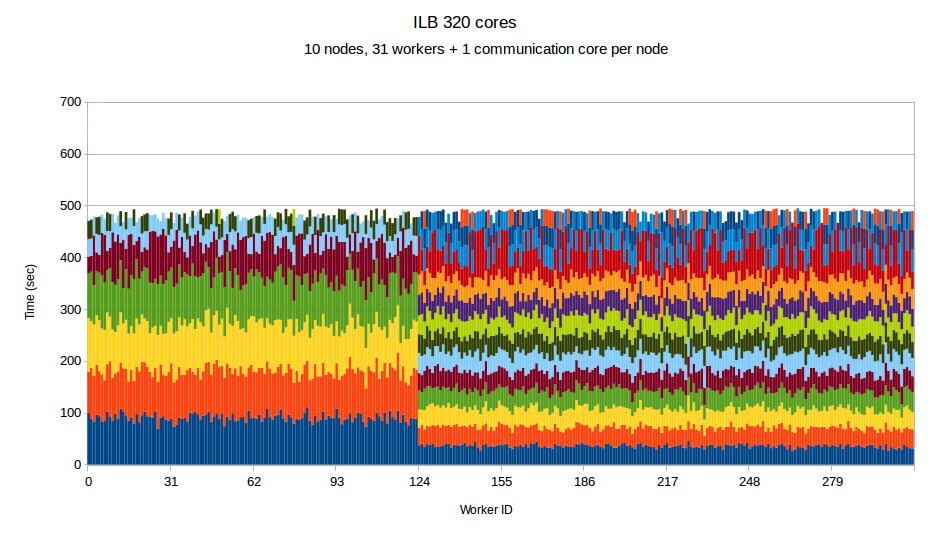
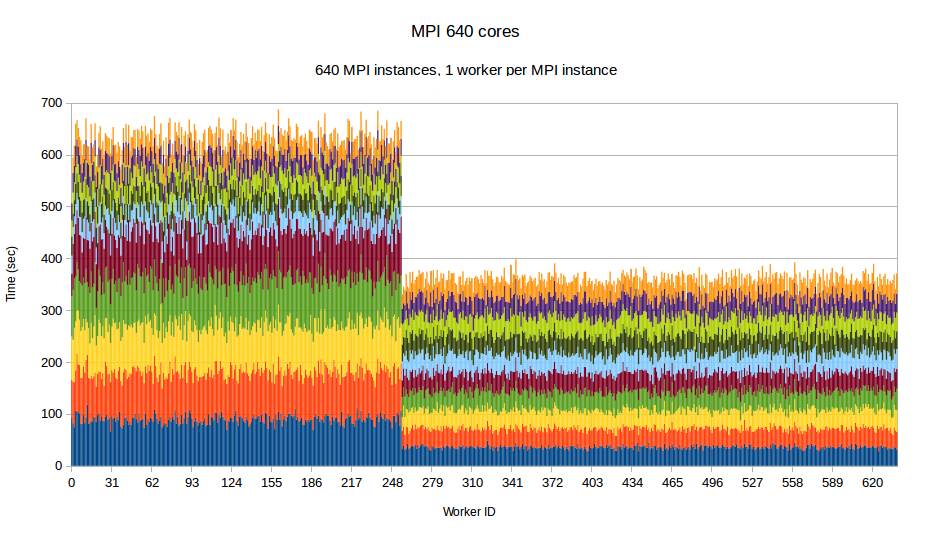
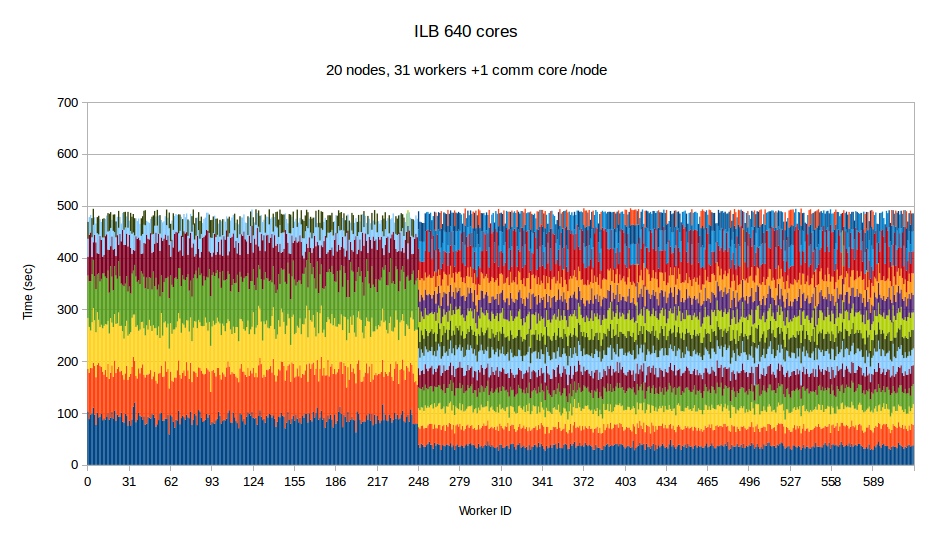
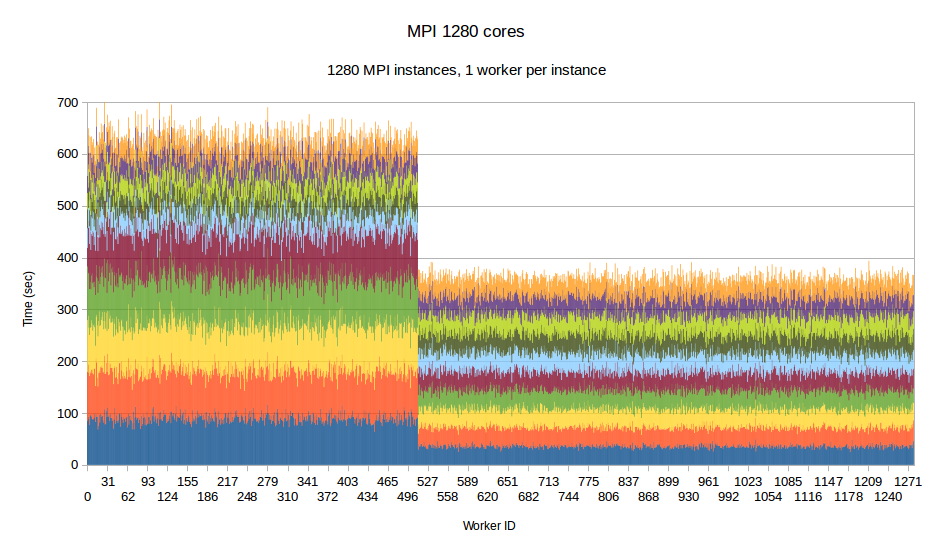
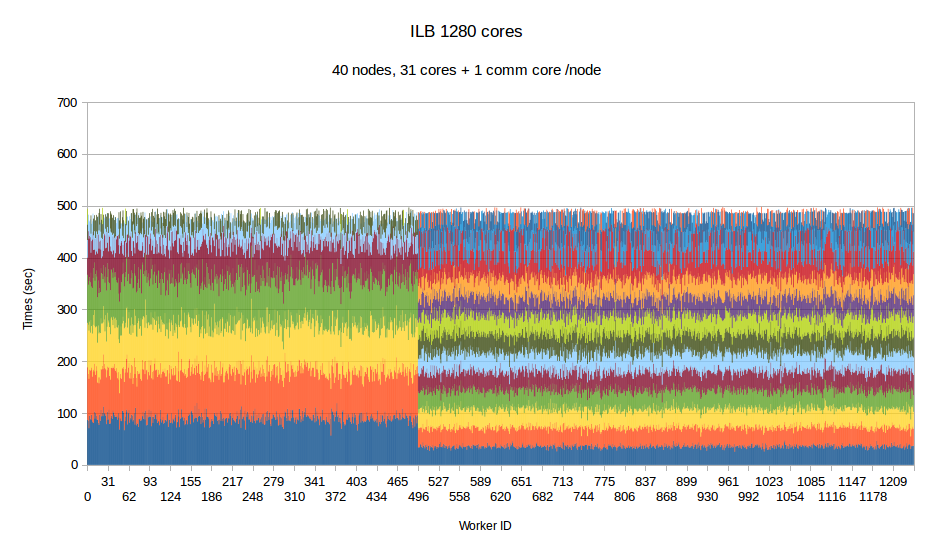
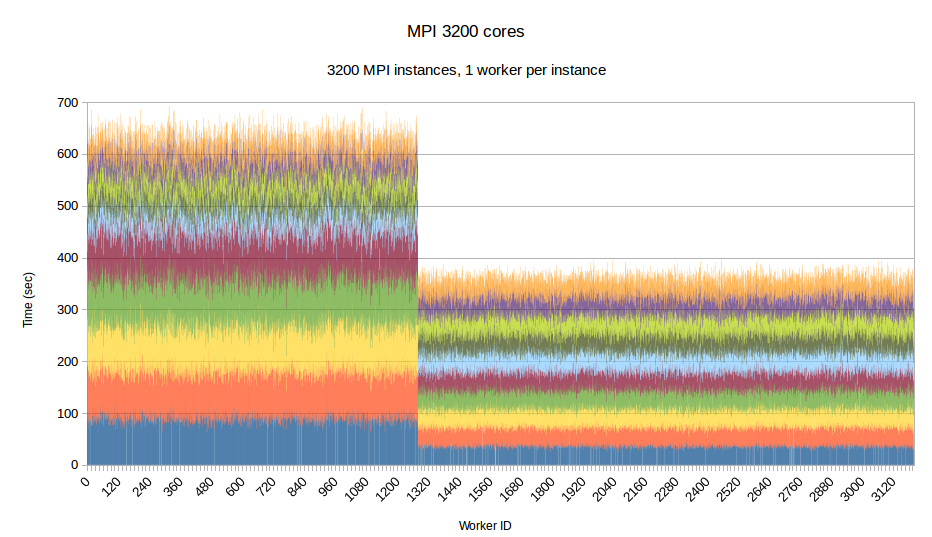
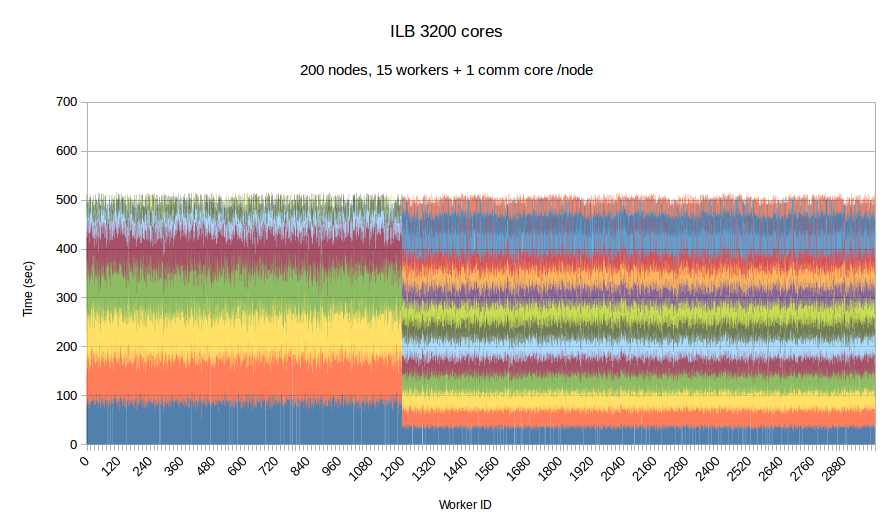
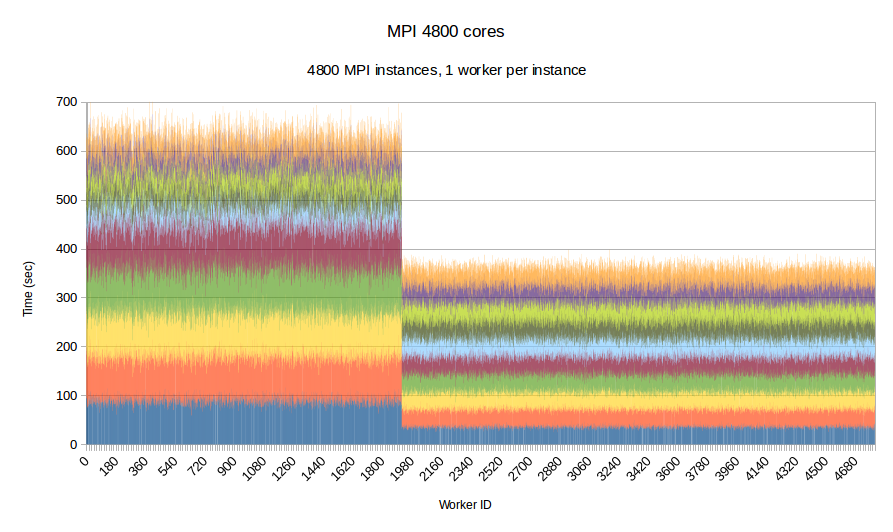
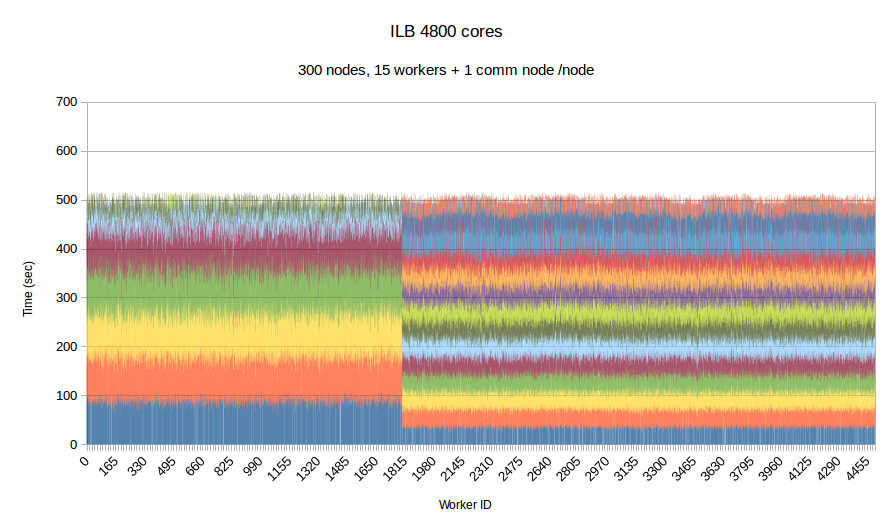
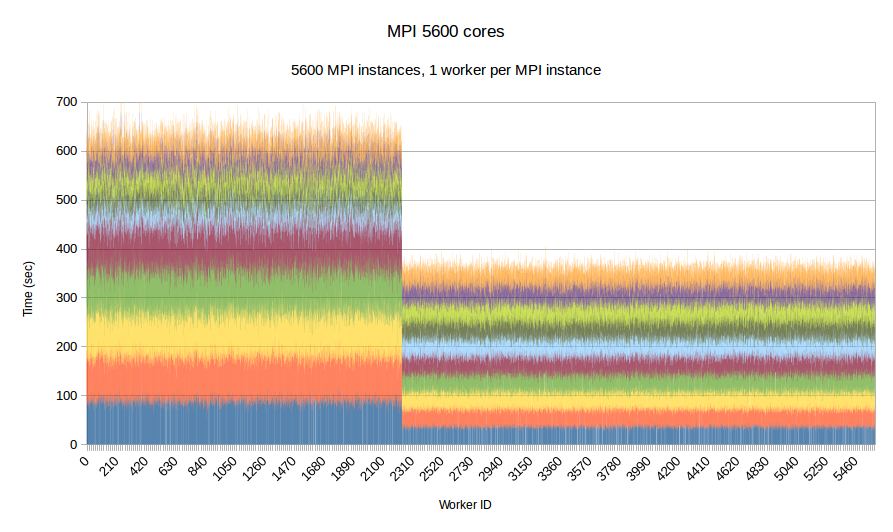
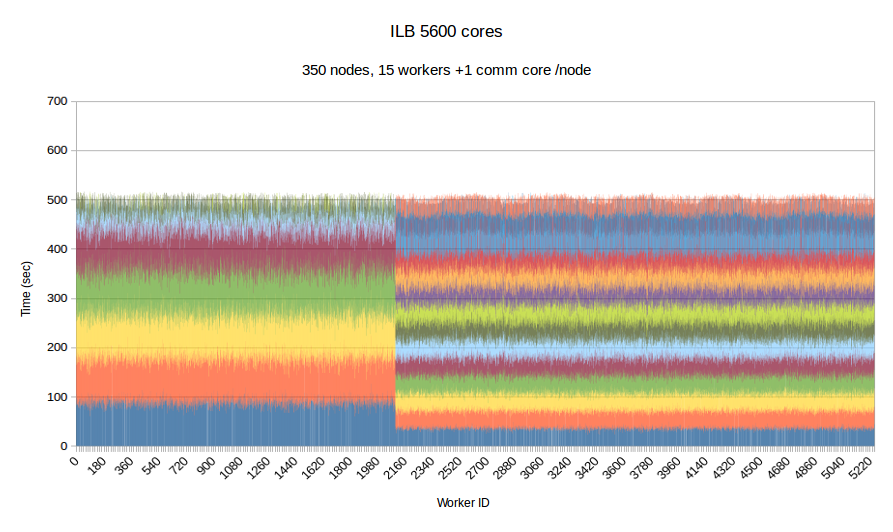
To examine the performance of our runtime system itself without the difficulties caused by the complexity of the applications running on top of it, we have developed a synthetic benchmark. The benchmark begins by dispersing work units to available processors, computation is the invoked via PREMA's messaging mechanism. Once computations of a data object are complete, a notification is sent back to the root processor. The application terminates once all notifications have been received. The number of subdomains per available core is set to 10, the weights of the individual workers are assigned to two categories, light and heavy. The average time of a heavyweight unit is 2.5 times the time of a lightweight one and 20% of the work units are assigned to the heavy category. In the graphs below, the load of different work units of the same worker is depicted with different colors. This helps to make the heavy tasks easily recognizable and to show how the work units have migrated among the workers in the case of PREMA. Figures 1-3 show performance for PREMA using 1 core for communication per 32 cores and figures 4-6 using 1 per 16 cores.
|
|
| Figure 1. Per worker load comparison between MPI and PREMA with ILB on 320 cores. MPI uses 320 as workers while PREMA uses 310 for workers plus 10 for communication | |
|
|
| Figure 2. Per worker load comparison between MPI and PREMA with ILB on 640 cores. MPI uses 640 as workers while PREMA uses 620 for workers plus 20 for communication | |
|
|
| Figure 3. Per worker load comparison between MPI and PREMA with ILB on 1280 cores. MPI uses 1280 as workers while PREMA uses 1240 for workers plus 40 for communication | |
|
|
| Figure 4. Per worker load comparison between MPI and PREMA with ILB on 3200 cores. MPI uses 3200 as workers while PREMA uses 3000 for workers plus 200 for communication | |
|
|
| Figure 5. Per worker load comparison between MPI and PREMA with ILB on 4800 cores. MPI uses 4800 as workers while PREMA uses 4500 for workers plus 300 for communication | |
|
|
| Figure 6. Per worker load comparison between MPI and PREMA with ILB on 5600 cores. MPI uses 5600 as workers while PREMA uses 5250 for workers plus 350 for communication | |
| #cores | Load balance overhead (sec) | Time to initialize (sec) | Min refinement time (sec) | Max refinement time (sec) | Total time (sec) | ||||||
|---|---|---|---|---|---|---|---|---|---|---|---|
| Max | Min | Avg | ILB | MPI | ILB | MPI | ILB | MPI | ILB | MPI | |
| 320 | 0.84 | 0.0001 | 0.07 | 0.83 | 1.28 | 324.9 | 494.4 | 681.8 | 495.5 | 683.2 | |
| 640 | 0.82 | 0.0001 | 0.05 | 1.39 | 0.97 | 321.4 | 495.1 | 687.1 | 496.8 | 692.7 | |
| 1280 | 0.76 | 0.0001 | 0.05 | 1.35 | 1.57 | 324.7 | 497.7 | 704.1 | 499.3 | 713.1 | |
| 3200 | 0.37 | 0.0002 | 0.05 | 2.81 | 2.31 | 322.1 | 516.4 | 691.9 | 520.5 | 717.2 | |
| 4800 | 0.35 | 0.0001 | 0.04 | 2.77 | 3.64 | 322.6 | 519.8 | 704.7 | 524.9 | 745.5 | |
| 5600 | 0.48 | 0.0003 | 0.04 | 3.36 | 5.75 | 310.6 | 520.4 | 717.8 | 526.4 | 770.1 | |
Decoupled CDT3D
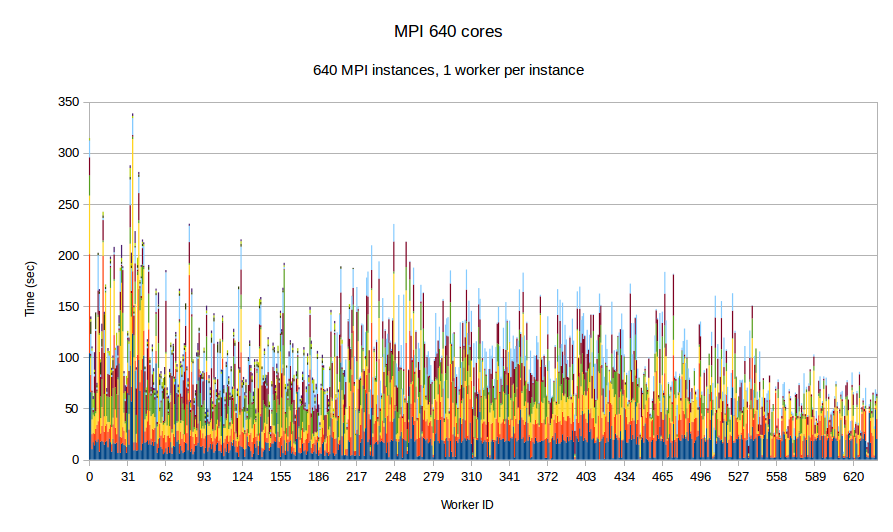
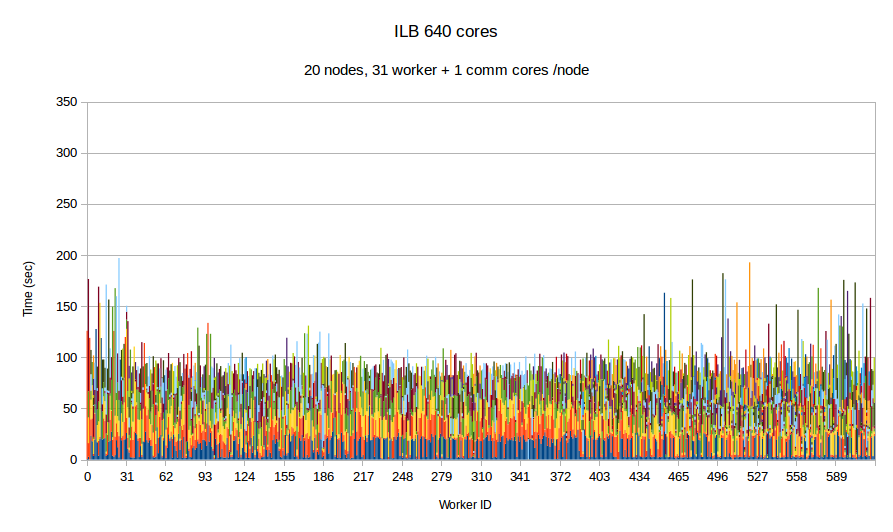
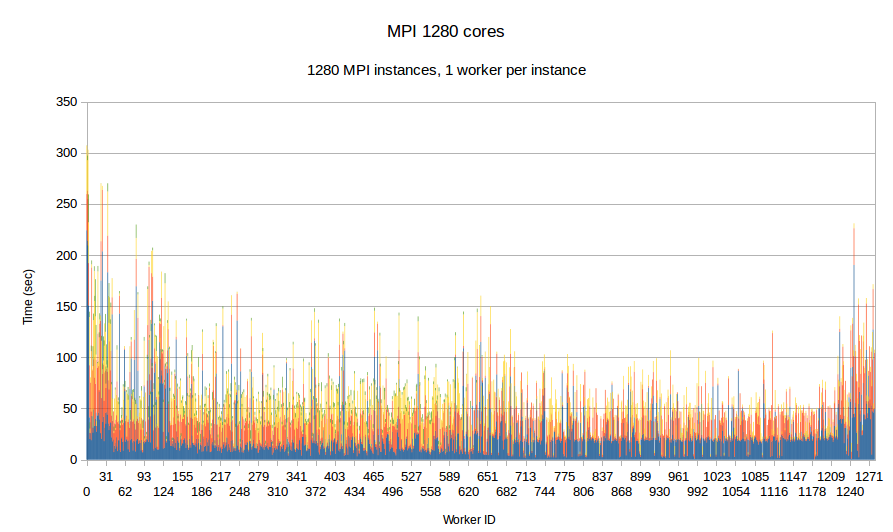
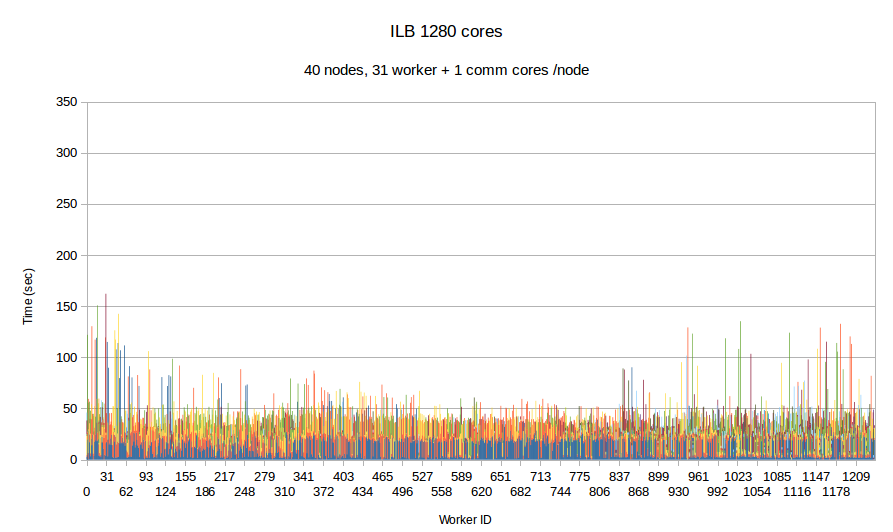
In this experiment, we use our in-house mesh generation software CTD3D to test the performance of PREMA with ILB in a real application. We test our software with 4 core allocations of 640, 1280, 3200 and 5600 cores and compare its performance with the respective MPI version of the code. In the first two figures, the initial mesh used consists of about 30 million elements and we create 4.5k subdomains in total. In addition to the comparison with MPI we can see the performance strong scaling between the 640 and 1280 core allocations of PREMA. For the 3.2k and 5.6k core allocations we use an initial mesh with 110 million elements from which we create 26.9k subdomains. There is no MPI version for the 3.2k core allocation because the program took too long to terminate and was stopped prematurely.
|
|
| Figure 7. Per worker load comparison between MPI and PREMA with ILB on 640 cores. MPI uses 640 as workers while PREMA uses 620 for workers plus 20 for communication. Initial mesh: 30mil elements, 4.5k subdomains | |
|
|
| Figure 8. Per worker load comparison between MPI and PREMA with ILB on 1280 cores. MPI uses 1280 as workers while PREMA uses 1240 for workers plus 40 for communication. Initial mesh: same as fig.7 | |
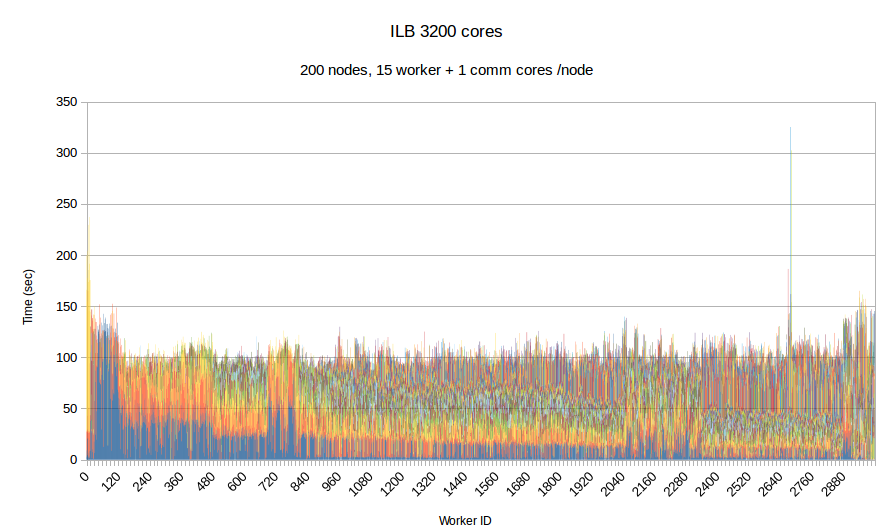
| |
| Figure 9. Per worker load in PREMA with ILB on 3200 cores. 3000 cores for workers plus 200 for communication. Initial mesh: 110mil elements, 26.9k subdomains | |
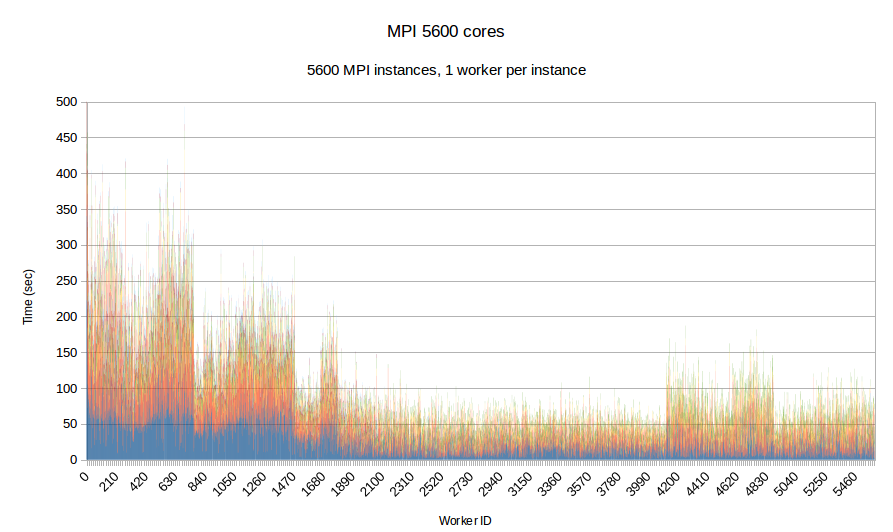
|
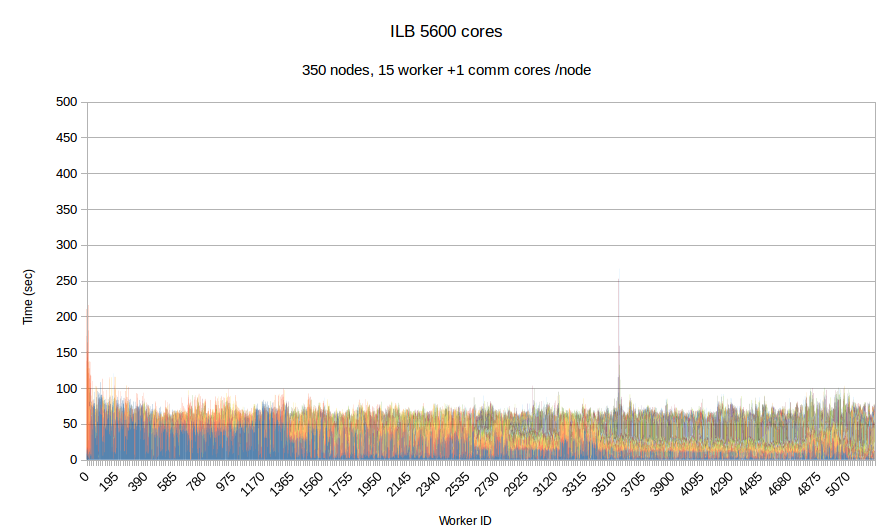
|
| Figure 10. Per worker load comparison between MPI and PREMA with ILB on 5600 cores. MPI uses 5600 as workers while PREMA uses 5250 for workers plus 350 for communication. Initial mesh: same as fig.9 | |
| #cores | Load balance overhead (sec) | Time to initialize (sec) | Min refinement time (sec) | Max refinement time (sec) | |||||
|---|---|---|---|---|---|---|---|---|---|
| Max | Min | Avg | ILB | MPI | ILB | MPI | ILB | MPI | |
| 640 | 7.0 | 0.00004 | 0.18 | 0.47 | 0.32 | 197.25 | 349.6 | ||
| 1280 | 0.82 | 0.0001 | 0.05 | 1.79 | 0.92 | 163.12 | 322.79 | ||
| 3200 | 37.9 | 0.004 | 0.64 | 3.11 | - | 325.97 | - | ||
| 5600 | 29.5 | 0.002 | 0.48 | 0.49 | 18.2 | 252.5 | 1353.3 | ||