Difference between revisions of "Data Management"
From crtc.cs.odu.edu
(→Next-generation imaging filters and mesh-based data representation for phase-space calculations in nuclear femtography) |
(→Next-generation imaging filters and mesh-based data representation for phase-space calculations in nuclear femtography) |
||
| Line 2: | Line 2: | ||
== Next-generation imaging filters and mesh-based data representation for phase-space calculations in nuclear femtography == | == Next-generation imaging filters and mesh-based data representation for phase-space calculations in nuclear femtography == | ||
| − | + | <gallery heights=300px widths=300px mode="packed-hover" caption="Tomographic pictures of the nucleon"> | |
| − | + | File:Paraview_plot.png|350px| | |
| − | + | File:Plot.png|350px| | |
| − | + | </gallery> | |
| − | |||
| − | |||
Tomographic and recently aquired and tessellated pictures of the nucleon as a result of this project. Namely, the plots show a spatial distribution of up quarks as a function of proton's momentum fraction carried by those quarks. Specifically, bX and bY are the spatial coordinates (in 1/GeV = 0.197 fm) defined in a plane perpendicular to the nucleon’s motion, x is the fraction of proton’s momentum and color denotes probability density for finding a quark at given (bX, bY, x). | Tomographic and recently aquired and tessellated pictures of the nucleon as a result of this project. Namely, the plots show a spatial distribution of up quarks as a function of proton's momentum fraction carried by those quarks. Specifically, bX and bY are the spatial coordinates (in 1/GeV = 0.197 fm) defined in a plane perpendicular to the nucleon’s motion, x is the fraction of proton’s momentum and color denotes probability density for finding a quark at given (bX, bY, x). | ||
Revision as of 19:01, 9 July 2019
Contents
Next-generation imaging filters and mesh-based data representation for phase-space calculations in nuclear femtography
- Tomographic pictures of the nucleon
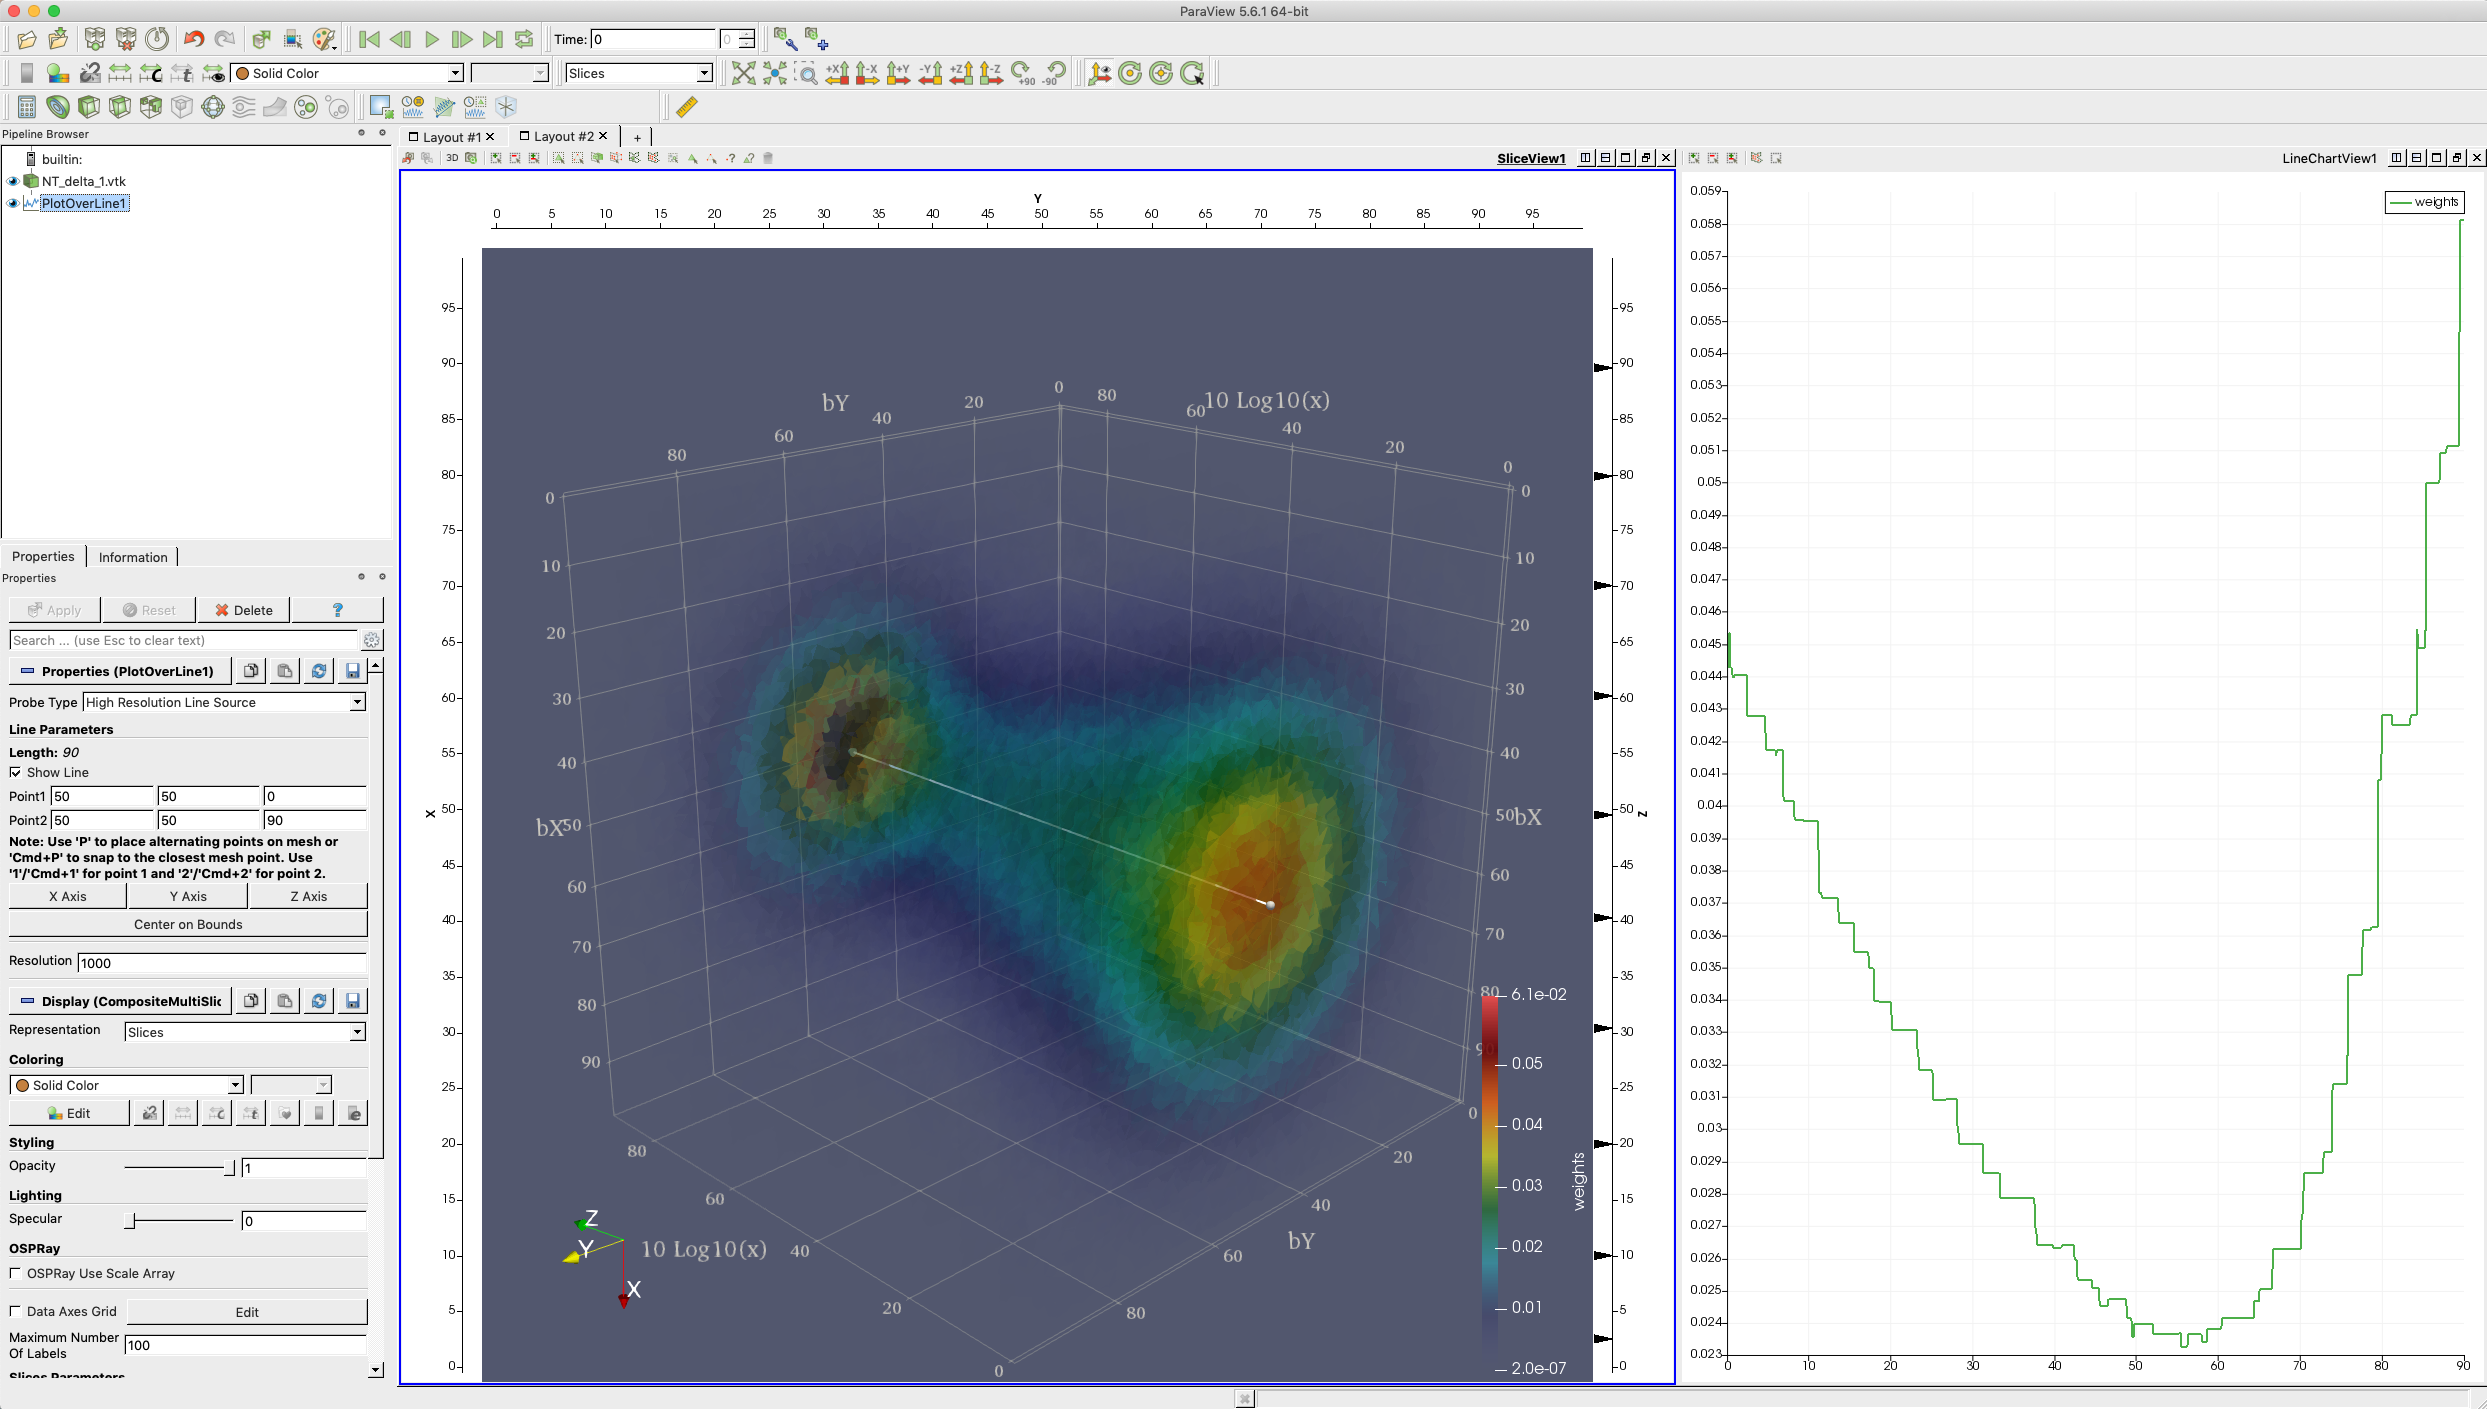
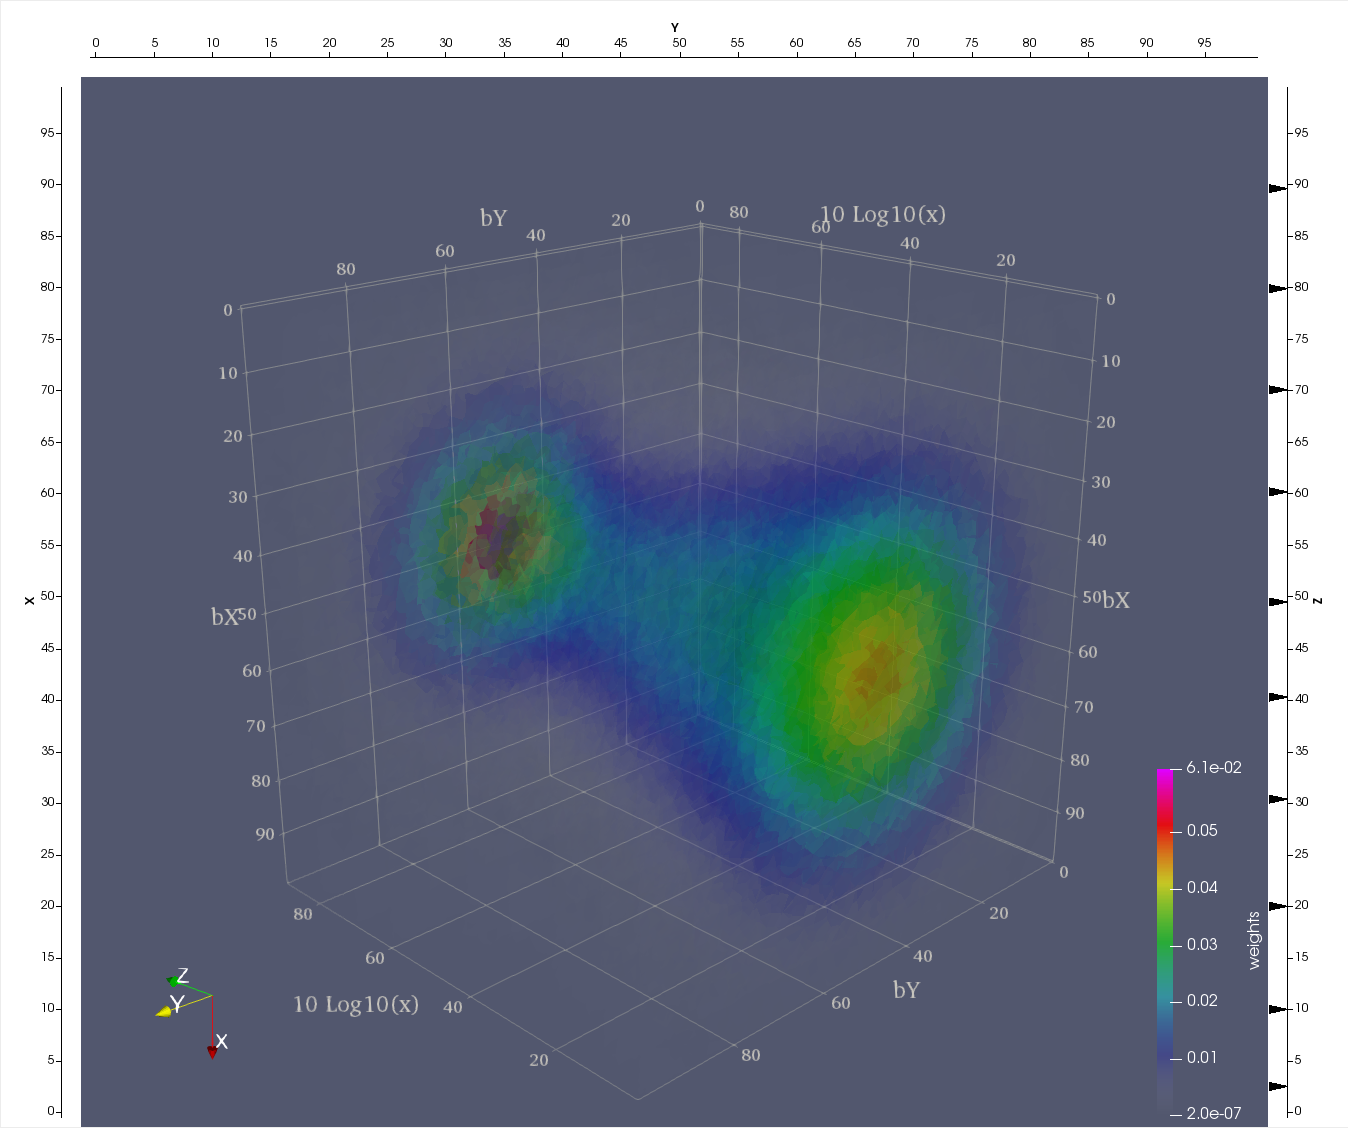


Tomographic and recently aquired and tessellated pictures of the nucleon as a result of this project. Namely, the plots show a spatial distribution of up quarks as a function of proton's momentum fraction carried by those quarks. Specifically, bX and bY are the spatial coordinates (in 1/GeV = 0.197 fm) defined in a plane perpendicular to the nucleon’s motion, x is the fraction of proton’s momentum and color denotes probability density for finding a quark at given (bX, bY, x).
Plots produced by Dr. Gagik Gavalian and Dr. Pawel Sznajder and tesselated by CRTC's Image-to-Mesh (I2M) conversion software deployed to Jefferson Lab last month.
For more data and information about this project follow this link: CNF
Exascale-Era Finite Element Mesh Generation
